Taking the weather with you with JS
A brief about how I built a small web app to read data from my weather station and animate it using CSS and SVG! You can check the app out on in my portfolio.
My dad had a mighty extensive music collection when I grew up. There were all kinds of vinyl, tapes, and CDs arranged across shelves and storage boxes, including the Beatles, The Troggs, The Kinks, REM, and so many more.
One of the CDs sitting amongst the hundreds was the album Woodface, from the Australian and New Zealand rock band Crowded House. A particular track on this album has followed me throughout my life titled "Weather with You". It's a catchy song you have probably heard as a backing track to a TV show at some point and most of the verses don't make a great deal of sense. But the chorus boldly states
Everywhere you go, always take the weather with you!
I remember recording this track onto a cassette to make a mix tape for my walkman on long car drives - I would certainly have found it hard to imagine that one day I would be thinking of this as inspiration for a Javascript project but here we are.

Fast forward a couple of decades from my childhood and here I am - a web developer with an itch to build cool web apps that act as a learning exercise to improve my front-end skills. Like any artist though - I need an idea, some inspiration to focus my efforts in the world of CSS and JS.
Netatmo Weather Station
I was lucky enough to receive a Netatmo Weather Station![]() as a bonus from work a year or two back. It is a collection of devices that one sets up in their garden to read live weather information including a thermometer, barometer, anemometer and rain gauge. Netatmo also provides an iOS app and a web app that renders the information onto your phones and other devices in a rich data format with charts and numbers all over the screen.
as a bonus from work a year or two back. It is a collection of devices that one sets up in their garden to read live weather information including a thermometer, barometer, anemometer and rain gauge. Netatmo also provides an iOS app and a web app that renders the information onto your phones and other devices in a rich data format with charts and numbers all over the screen.

Additionally, there is also a Netatmo API that allows you to query your weather station to retrieve live data from your devices. So I began setting up a way to query this following their documentation and setting up OAuth2 integration. At a basic level, this worked but it required the site to manage tokens and even then it only granted access to some weather data. For instance, I also wanted access to cloud cover, lux censors and sun angles for my location and that was not available through Netatmo. But they were available through other smart products already running in my home.
Home Assistant
Over the years I have become a bit of a smart home fanatic with my poison preference being Apple's Homekit. Whilst Matter is still in its infancy one of the major drawbacks with all smart home providers is that not all devices work with all ecosystems. As such there are solutions to this problem such as Home Assistant![]() that act as a bridge between all devices and your smart home controller.
that act as a bridge between all devices and your smart home controller.

A colleague showed me how to set up a tunnel to assign your Home Assistant bridge to a public subdomain. This would make it accessible outside of your home network without needing to cumbersomely open firewall ports. After setting up some basic WAF rules and auth headers, I made my Home Assistant API queryable. The system requires auth and is geo-limited to minimise the risk of malicious actors.
Querying the data
So now it was time to query the data from Home Assistant and make my end-point that can safely be queried client side. This new endpoint would accept no parameters and cherrypicks only the data needed to render UI ignoring everything else. Next App router makes this very easy serving a public end-point that on the server side calls the HA end-point with auth making the HA address invisible to the end-user.
The data is then formatted nicely in JSON to make it easily consumable by the app.
Enter Storybook.js
To build a visual display of the current weather data I needed a decent way to be able to test the various weather conditions the data from the station could portray. Storybook![]() has been my home for all front-end design and construction for the past few years. It is a powerful tool used to render and test front-end components in a project. It is exceptionally useful for allowing you to set props on components inside its GUI so you can test in real-time without making code changes.
has been my home for all front-end design and construction for the past few years. It is a powerful tool used to render and test front-end components in a project. It is exceptionally useful for allowing you to set props on components inside its GUI so you can test in real-time without making code changes.
My website already had a Storybook design system![]() so adding another component to it was a trivial exercise.
so adding another component to it was a trivial exercise.

I created a type for the props the component would take and began setting up the DOM via styled-components.
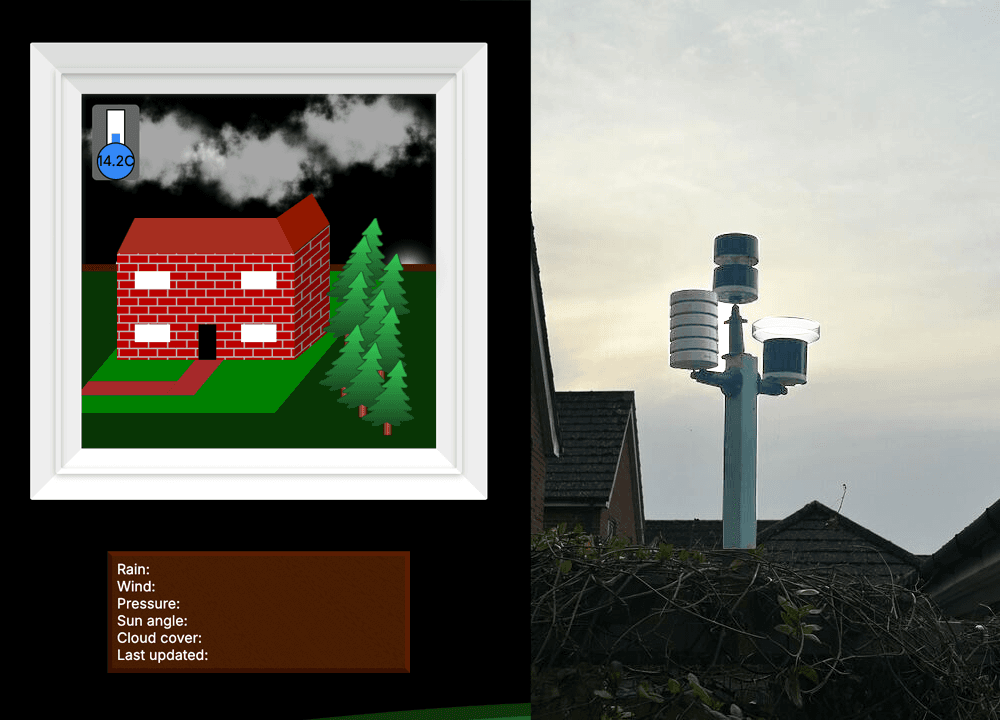
To make the interface exciting but easy to adjust I decided to draw my own house using an SVG. After some toying around with the viewBox and coordinates I settled on a nice isometric viewpoint and began drawing walls, roofs and gardens in flat colours. The output was a basic-looking house resembling some of my childhood MS Paint drawings.
So obviously I needed to add texture to my surfaces and other elements that would change based on weather conditions. So first up I googled CSS brick gradients and saw that a repeating linear gradient could do that. The problem? It was not so easy to use in SVG elements. I hacked away for a while but to no avail. So I did what any great developer does and threw a question up onto Stack Overflow. Almost immediately I had a perfect answer to use an SVG pattern rather than gradient. And just like that my house looked a little more real.
<pattern id="brickPattern" width="54" height="48" patternUnits="userSpaceOnUse">
   <rect width="100%" height="100" class="mortar" />
   <rect width="50" height="20" x="0" y="0" fill="#b00" />
   <rect width="25" height="20" x="0" y="24" fill="#b00" />
   <rect width="25" height="20" x="29" y="24" fill="#b00" />
</pattern>
An SVG pattern used to render bricks
Next up I set about drawing some trees in CSS that were wrapped in a component and accepted props to adjust the way they leaned based on wind speed and direction. It then placed a few around the house and put a sun and moon in the sky. Finally, I took some of my CSS clouds and added them to the sky and there I had it a basic scene.
I naturally wanted to make the sky a little more interesting. So I retrieved the sunrise and sunset times from Home Assistant, and then I needed cloud cover. Netatmo does not provide this very well, but Tado does (I am not entirely sure why a smart heating system would do this, but it does). I updated my API to provide this and then I needed a cloud. I could use an image but I had already built a flight over cloud pov animation in CSS![]() so there was no way I was going to resort to a PNG file in this SVG graphic masterpiece.
so there was no way I was going to resort to a PNG file in this SVG graphic masterpiece.

As the design system follows atomic design principles![]() it was easy to import the cloud used in the flight component into my weather station component. With that in mind, I could also use my rain component to animate the sky when rainfall was detected, and thus I imported that too.
it was easy to import the cloud used in the flight component into my weather station component. With that in mind, I could also use my rain component to animate the sky when rainfall was detected, and thus I imported that too.

Now the component was rendered in Storybook![]() I could start testing the visual display without having to mock data, The Storybook controls allow me to set values for testing components and I could quickly see what impact changing various props would have.
I could start testing the visual display without having to mock data, The Storybook controls allow me to set values for testing components and I could quickly see what impact changing various props would have.
Bringing it all together
The only part left to do was create a page in the Next App router site and hook the APIs up to the component. I created a page quickly in the Next App Router and set up a container component responsible for handling the state and calling the new end-points. This container then passes the returned data into the weather station display component, and it all comes to life. You can see it now at /portfolio/weather.

This whole exercise was a learning curve on so many fronts. It was immensely beneficial to get exposure to Cloudflare configuration, Home Assistant setup and Next API handling. Additionally, learning how to animate SVGs and clouds with CSS was difficult but rewarding.
Everywhere I go - I will always take the weather with me.